


The Week Brief, the Content Batch, and the Monday Call List — prepared by Edmund Bogen
You have built the systems. The voice print, the prompt library, the listing machine, the database triggers. And every one of them only runs when you remember to run it — which means they run in good weeks and quietly stop in busy ones. This is the session where they start running without you. Type eleven numbers on a Sunday evening, and three scheduled AI tasks turn them into your market brief, your week's content and your call list while the house sleeps. Unattended scheduling reached every account tier in August 2026, which is what makes this buildable now — and the $0 tier allows exactly three active tasks, so we build exactly three systems.
You have built the systems. The voice print, the prompt library, the listing machine, the database triggers. Every one of them only runs when you remember to run it — so they run in good weeks and quietly stop in busy ones.
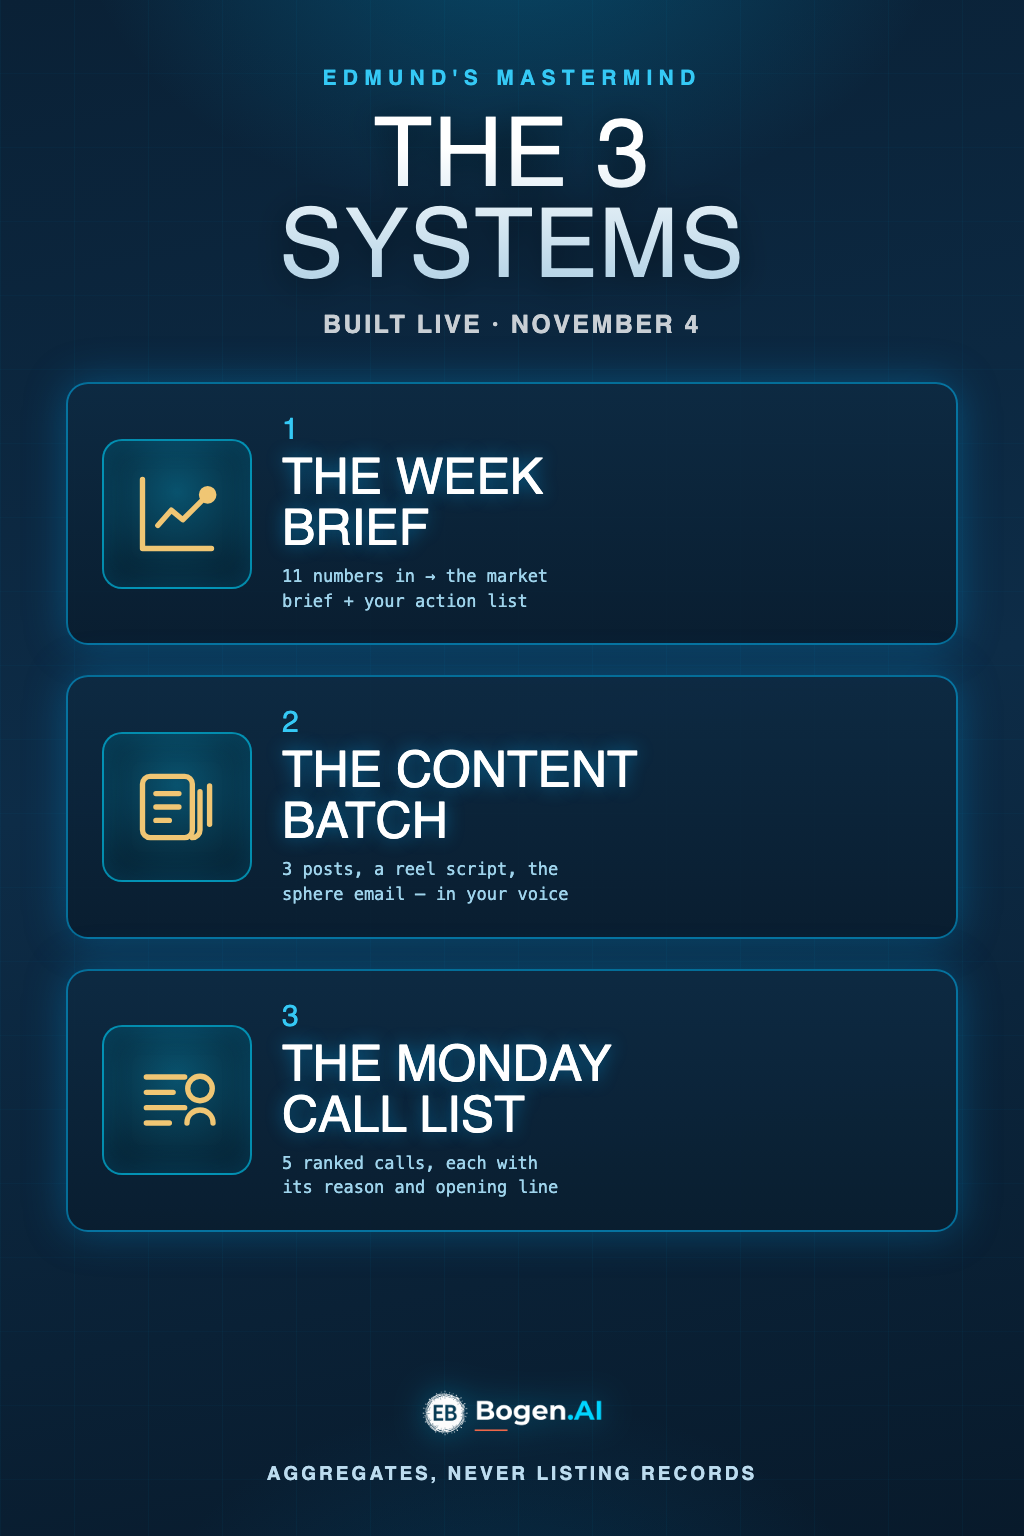
We will master 3 systems live, together:
1 · The Week Brief — eleven numbers you type in become a client-ready market brief for your farm, plus a private action list that ranks your own listings against the market.
2 · The Content Batch — the same run turns that brief into the week's content: three posts, a reel script, and the sphere email, in your voice, about this week.
3 · The Monday Call List — your database ranked on tenure, equity and contact gaps, returning five calls with the reason and the opening line for each.
Register for the SessionEvery page of the 39-page course study is on this page, in order — the PDF is the same content, formatted to print. Jump to any section:
Three systems, and the three skills underneath them: reading market arithmetic, writing a prompt that holds up unattended, and designing a scoring model you can defend.
| # | Module | The skill it teaches | Pages |
|---|---|---|---|
| 1 | How unattended runs work | The three execution models, what a scheduled run can and cannot see, and why most first builds fail silently | 3–5 |
| 2 | Data you may and may not use | Classifying your data against your MLS licence, and detecting proxy variables before they reach a model | 6–9 |
| 3 | Market arithmetic | What each metric measures, the two ways to compute supply, the small-sample problem, and the two-population error | 10–17 |
| 4 | Prompt architecture | The six components of a prompt that survives unattended execution, and the chaining pattern | 18–23 |
| 5 | Scoring-model design | Choosing inputs, setting weights, why caps exist, and how to tune a model that disagrees with you | 24–30 |
| 6 | Scheduling and diagnosis | Building the three tasks, and diagnosing the six ways they fail | 31–33 |
| 7 | The weekly rhythm | Operating the system, and the feedback loop without which it decays | 34 |
Modules 1–5 each end with a worked exercise. Every answer key is in Appendix A (pages 30–33). Do the exercise before you look. The arithmetic ones are the ones that matter — if you cannot do them by hand, you cannot tell when the model has got them wrong, and it will.
Almost every failed build in week one is a person running a task in a context that cannot see what the task needs.
| Model | Can see | Cannot see | Use it for |
|---|---|---|---|
| 1 · Plain chat a one-off conversation | Only what you paste into that thread | Your files, your other chats, anything from last week | Testing a prompt once, nothing more |
| 2 · Project chat a chat inside a project | The project's files and instructions, plus the thread | Other projects; other threads in the same project | Developing and debugging your prompts |
| 3 · Scheduled task fires on a cadence | Its own prompt text, and — only if attached to a project — that project's files and instructions | Your screen, your email, last week's run, anything you did not write into it | The three systems, once they work |
A scheduled task does not remember its own previous output. Sunday the 11th does not know what Sunday the 4th produced. Every run begins with an empty head and whatever you have handed it.
This has a consequence people discover in week three and misdiagnose as the model "getting worse": anything you want compared across weeks has to live in a file, not in the conversation.
If a system needs last week's number to say something useful this week — and System 1 does, because year-over-year and week-over-week comparison is most of its value — then last week's number must be written into the project as a file. Keep a running log. One row per week, eleven columns. The task reads the file; the file is the memory.
Two of the three systems are genuinely unattended. System 1 is not, and the course will not pretend otherwise.
| System | Needs from you each week | Why |
|---|---|---|
| 1 · Week Brief | Eleven numbers, typed in | No AI can read your MLS member report for you, and Module 2 explains why you would not want it to |
| 2 · Content Batch | Nothing | It reads System 1's output from the project |
| 3 · Call List | Nothing, if your export is current | It reads the contact file from the project |
The honest description: ten minutes of data entry, three systems that run themselves, fifteen minutes of review. Anyone selling "fully automated" here is selling a system that pastes your MLS data into a chatbot.
Two of these limits change what you can build. The rest are detail.
| Capability | ChatGPT | Claude |
|---|---|---|
| Scheduled recurring prompts | Yes, every tier including $0 | Yes, paid plans (Pro, Max, Team, Enterprise) |
| Weekly cadence | Yes | Yes — hourly, daily, weekdays or weekly |
| Runs with your machine shut | Yes | Yes, remotely, since July 2026 |
| Active tasks allowed | 3 on $0 and Go · 5 Plus · 10 Business · 15 Pro | Not published |
| Choosing the exact hour | Paid only; $0 runs in a window (morning / afternoon / night) | Set per task |
| Custom GPT on a schedule | Not supported | Skills and connectors available |
Platform documentation, verified October 2026. Allowances change — re-check before you build. Sources, page 38.
If your work currently lives inside a Custom GPT, that work does not move to a schedule. It has to be rebuilt as project instructions plus a saved prompt. These are not the same object and the migration is not automatic.
Transfers: instruction text, knowledge files. Does not: conversation starters, name and icon, Actions or API calls, and anything configured through the builder's chat rather than its Configure tab.
System 2 reads System 1's output. If System 2 runs first it reads nothing and writes generic content from an empty brief — confidently, without erroring.
| If you are on… | Chain them like this |
|---|---|
| A paid tier | Stagger by exact time: System 1 at 6:00pm, System 2 at 6:30pm, System 3 at 6:15pm. Thirty minutes is ample. |
| The $0 tier | Order inside a window is not guaranteed. Merge Systems 1 and 2 into one task producing brief then content in a single run — two slots, and the ordering problem disappears. |
An agent builds System 3 as a scheduled task in a plain chat — not attached to a project — with their contact export pasted into the prompt itself. It works perfectly the first Sunday. Four weeks later it is surfacing people they have already closed.
Answer key: Appendix A, page 30.
Everything after this point assumes the project exists. Build it before Module 2.
| Platform and tier I am on | |
| Active scheduled tasks my tier allows | |
| Exact time, or window only? | |
| Therefore: three separate tasks, or merge 1 and 2? | |
| Anything of mine currently stuck inside a Custom GPT |
The model will happily accept your hot sheet. That is not the same as you being allowed to give it.
Three facts, each from a published source, and together they define the boundary:
NAR's position is that innovation is welcome provided use complies with MLS rules and the data licence. The duty sits with you.
Sort every piece of data you are tempted to paste:
| Category | Examples | What it is | Into a public model? |
|---|---|---|---|
| A — Your own | Your listings, your showings, your pipeline, your notes | Your brokerage's business record | Yes — subject to your brokerage policy |
| B — Aggregates you derived | Counts, medians, ratios, months of supply | A statistic about many homes; no individual record | Yes — this is what the course uses |
| C — Others' listing records | Hot sheet rows, IDX feed, another broker's listing detail, MLS numbers, addresses | Licensed data belonging to the MLS compact | No |
| D — Client personal data | Names, contact details, financial position | Personal information you hold in trust | Only in a closed system, minimised — see 2.4 |
System 1 takes Category B only: eleven numbers you read off your member report and type in. There is nothing to redistribute because no record is ever transmitted. System 3 takes Categories A and D, minimised to initials (Lesson 2.4).
A procedure you can run in about fifteen seconds per column, before anything is uploaded.
System 3 needs your database. It does not need your clients' identities. Reduce the export before you upload it:
| Field | Keep? | Why |
|---|---|---|
| Full name | Replace with initials | The ranking never needs identity; you re-attach names from your own CRM after |
| Contact ID | Keep | Your key for rejoining the output to real people |
| Email / phone / address | Drop | Never used by the model; pure exposure |
| Purchase date and price | Keep | Tenure and equity both derive from these |
| Estimated current value | Keep | The other half of equity |
| Last contact date, touch count | Keep | The neglect signal |
| Free-text notes | Review first | Notes are where protected characteristics hide. See 2.5. |
Nobody reading this would add a column called "race". The risk is a field that correlates with a protected characteristic without naming it. Run this on every column you plan to score:
A notes column scraped across eleven years will contain "getting divorced", "new baby", "mother moving in", "church group", "wife's visa". Those are protected characteristics in prose. Either strip the notes column, or restrict it to a single curated field — which is exactly what the sample database's stated_or_behavioral_signal column is: one short line, written deliberately, nothing inherited.
System 3 sorts human beings into an order and then treats them differently based on that order. That is exactly the shape of activity Fair Housing law governs.
| ✅ Safe to rank on | 🚫 Never rank on |
|---|---|
| Tenure — how long they have owned | Inferred race, religion, national origin |
| Equity position on their own property | Familial status or disability |
| Months since you last made contact | Age, or any field standing in for it |
| Listings they actually viewed or saved | "Neighborhood fit" logic |
| Preferences they stated themselves | School-district language used as a family proxy |
| Purchase anniversary and other time events | Anything you could not explain to a regulator |
The line is not "avoid personal topics". It is about where the information came from.
Both sentences could produce the same call. Only one survives the question "why did you contact them and not someone else?"
Complete list, and the reason each one is defensible:
| Input | Why it is a behavior or a fact about the property, not a characteristic of the person |
|---|---|
| Equity gain | A fact about their property's value against what they paid. Says nothing about them. |
| Tenure | Elapsed time since a transaction you were part of. A date, not a demographic. |
| Months since contact | A fact about your behavior, not theirs. |
| Stated or observed signal | Something they said or did. The strongest and most defensible input there is. |
| Touch neglect | Again a fact about your own conduct. |
| Relationship type | The role they played in a past transaction with you. |
Read that table aloud. Nothing in it describes who a person is. Four of the six describe either a property or your own conduct. That is what makes the model explainable, and explainability is the whole defence.
Below is a column list from an actual CRM export. Classify every column, then decide what to do with it.
| # | Column as exported | Category (A/B/C/D) | Keep, drop, or replace? | Safe to score on? |
|---|---|---|---|---|
| 1 | contact_full_name | |||
| 2 | purchase_price | |||
| 3 | mls_number_of_purchase | |||
| 4 | years_owned | |||
| 5 | bedrooms_at_purchase | |||
| 6 | agent_notes_freetext | |||
| 7 | last_contact_date | |||
| 8 | preferred_language | |||
| 9 | competitor_listing_they_viewed | |||
| 10 | estimated_current_value | |||
| 11 | lead_source | |||
| 12 | household_size_estimated |
Answer key: Appendix A, page 30.
You are about to hand these to a model that will reason from them confidently whether or not they mean what you think.
| Metric | Measures | What distorts it | Watch for |
|---|---|---|---|
| New listings | Fresh supply entering | Relistings of the same home read as new; seasonal clustering at month start | Same address twice in a quarter |
| Price changes | Seller capitulation | Counts increases too unless you separate them; one home cutting 3× counts 3× | Record cuts and rises separately |
| Went pending | Demand actually converting | Pendings that later fall through still counted; contingent vs pending differ by MLS | Your MLS's status definitions |
| Closed | Completed transactions | Lags the market by 30–60 days — it describes contracts signed last month | Never use alone for "right now" |
| Active inventory | Current competition | Whether your MLS counts contingent/coming-soon as active | Keep the definition fixed |
| Median list (active) | What sellers are asking | Skewed by a few luxury outliers in a small farm | Median not mean; note outliers |
| Median DOM (active) | How long current stock has sat | Only measures unsold homes — survivorship: fast sellers already left | Rises when good stock sells |
| Median closed (30d) | What buyers paid | A different set of homes from the actives — see Lesson 3.4 | Not comparable to list |
| Close-to-list (30d) | Negotiation room on sold homes | Against final list, so reductions are invisible; a home cut 10% then sold at ask reads 100% | Original vs final list |
| Months of inventory | Market balance | Two formulas that disagree — Lesson 3.2 | Which one your MLS uses |
| Absorption (3-mo) | Pace of sale | Three-month average smooths real turns as well as noise | Lags a genuine shift |
Median DOM on actives suffers survivorship: it only describes homes that have not sold. A hot market where everything good sells in nine days leaves the stale stock behind, and your median DOM goes up while the market gets stronger.
Close-to-list is usually computed against the final asking price. A home listed at $1.2M, reduced to $1.0M, sold at $1.0M reports 100% — a perfect negotiation, concealing a 17% reduction. This is why close-to-list alone cannot tell you whether sellers are getting their price.
Your MLS reports one. Your model will compute the other. When they disagree, the disagreement is the information.
In the worked example the two methods give 6.2 and 2.4 months. That is not an error. It is the single most useful signal in the dataset, and here is how to read it:
| Pattern | What it means | What you tell a seller |
|---|---|---|
| Pending-based much LOWER than absorption-based | Demand is accelerating. Recent closings understate what is happening now. | "The closed numbers you are reading online are describing August. Right now homes are going under contract faster than that." |
| The two roughly agree | Stable market, no turn in progress | Quote either with confidence |
| Pending-based HIGHER than absorption-based | Demand is decelerating. The closed figures are flattering. | "Closings still look healthy, but that is last month's market. What is going under contract now has slowed." |
Every agent in the farm has the same MLS report. Almost none of them compute both methods, because the MLS hands them one number. The disagreement between the two is available to anyone and used by nearly nobody — and it is the difference between describing last quarter and describing this week.
Method B above multiplied a single week's three pendings up to a monthly rate. On a 412-home farm that is a very small number doing a lot of work — and it is exactly the error Lesson 3.4 is about. Use a trailing four-week pending count, not one week × 4.33, before you say any of this out loud.
This is the lesson that stops you confidently telling a seller something false, in writing, on a Tuesday.
A 412-home farm produces about four new listings and two or three closings a week. At that size ordinary variation looks exactly like a market shift — and a model narrates either with equal confidence.
| Weekly count | You may say | You may not say |
|---|---|---|
| Under 5 | "Four homes came on this week." A count, stated flatly. | Anything comparing it to last week. No percentages. No direction. |
| 5 to 15 | Compare to a four-week average, never to last week. | "Up 40% on last week." On these counts that is one extra house. |
| Any size, 4+ weeks | Direction of a rolling average. This is where trends legitimately live. | — |
This is why Module 1 had you create week-log.csv. With four weeks of history the brief can say "price cuts have run 6, 5, 7, 6 — steady at about six a week" instead of "price cuts fell 14% this week", which on these counts means one seller changed their mind.
| Metric | Weekly reading | Because |
|---|---|---|
| Active inventory | Reliable | A stock count of ~31, not a flow of 4. Large and directly observed. |
| Months of inventory | Reliable | Built on inventory plus a 3-month average — both smoothed |
| Median list, active | Reliable | Median of 31 homes |
| Median DOM, active | Careful | Reliable as a level; survivorship makes the direction treacherous |
| Median closed & close-to-list, 30d | Careful | A 30-day window helps, but that is still only ~8 homes here — plus the final-list distortion from 3.1 |
| New listings, pendings, closings, price cuts | Noisy | Flows of 2–4. Report as counts; trend only on 4-week averages. One indecisive seller can cut three times. |
The most quoted number in any market update, and the most commonly misread. Get this right and you sound like the only person in the room who has thought about it.
These two medians describe two different sets of houses:
No individual home appears in both figures. Subtracting one from the other does not produce a discount on anything; it compares the asking prices of the unsold to the achieved prices of the sold.
Close-to-list is the discount figure, because it compares each sold home to its own asking price. At 96.2%, homes that sold did so within 3.8% of ask. That is the same-home comparison; the gap is not.
Put the two figures together and a real conclusion appears:
Both statements come from the same two numbers. The second one is defensible, more useful to a seller, and is the argument the Week Brief is instructed to make. It also positions you correctly: you are not the agent delivering bad news, you are the agent explaining why the bad news everyone is reading is misread.
This two-population mistake recurs constantly: comparing average DOM of actives to average DOM of solds; comparing this year's closed median to last year's list median; comparing your listings' performance to "the market" when your listings are all in one price band. Before any comparison, ask whether both numbers describe the same homes. Usually they do not.
These are what the model is instructed to compute. Do them by hand once so you can audit them forever.
| Derivation | Arithmetic | Reading | Reliability |
|---|---|---|---|
| Year-over-year supply | 6.1 ÷ 4.3 − 1 = +42% | 42% more competition than last fall | Stock-based, solid |
| Cross-check | 31 ÷ 5.0 = 6.2 vs reported 6.1 | Inputs internally consistent | Always run this |
| Ask-to-close gap | 1,145,000 − 985,000 = $160,000 (16%) | Mispricing in the unsold pool — not a discount (3.7) | Small closed base |
| Negotiation room | 100% − 96.2% = 3.8% | Priced right, homes still sell near ask | Final-list caveat (3.1) |
| Seller pressure | 6 cuts ÷ 4 new = 1.5 | More sellers cutting than entering | Both flows tiny |
| Net absorption | (3+2) − 4 = −1 | Inventory shrank this week | One home either way flips the sign |
The two most dramatic-sounding derivations — seller pressure and net absorption — are the two least reliable on a farm this size. Net absorption of −1 means five homes left and four arrived. One extra listing on Saturday would have made it zero; two would have flipped it positive.
So in week one: note it, log it, say nothing public. If it stays negative three or four weeks running, then you have something — and you will be the only agent in the farm who saw it, because you were the only one logging.
When your brief has to lead with one thing, lead with the most reliable thing that is also interesting:
A 680-home farm. Work these by hand. A calculator is fine; the model is not.
| Metric | Wk 1 | Wk 2 | Wk 3 | Wk 4 |
|---|---|---|---|---|
| New listings | 7 | 5 | 9 | 8 |
| Price cuts | 4 | 6 | 5 | 11 |
| Went pending | 6 | 7 | 5 | 4 |
| Closed | 5 | 4 | 6 | 5 |
| Active inventory | 48 | 47 | 50 | 53 |
| Median list, active | $845k | $848k | $839k | $831k |
| Median DOM, active | 41 | 44 | 46 | 52 |
| Median closed, 30d | $792k | $795k | $788k | $790k |
| Close-to-list, 30d | 97.8% | 97.5% | 97.1% | 96.4% |
| Absorption, 3-mo avg | 20.0 | 20.0 | 19.5 | 19.0 |
| Months of inventory (reported) | 2.4 | 2.4 | 2.6 | 2.8 |
Answer key: Appendix A, page 31. Question 6 has a model answer with commentary.
From the eleven Coral Ridge inputs. Read it as the standard, then read page 17 before you trust it.
96-DOM listing — 38 days past the 58-day market median. This week's price conversation. Evidence: six cuts in the farm this week, inventory up 42% year over year, a $160,000 ask-to-close gap.
47-DOM listing — approaching the median. Pre-empt it. Show this seller the trend now, so a reduction at day 60 is their idea rather than your bad news.
12-DOM listing — healthy. Four showings this week. Report and reassure.
What I would otherwise have missed: net absorption was negative this week — five properties left, four came on.
Notice what this lets you say on the 96-day call. Not "we need to drop the price." Instead:
The market made that argument. You are carrying it, not inventing it — which is why it lands as counsel rather than as pressure.
This came from the same eleven inputs. Four errors. Find them before you read the annotations.
| # | The claim | Why it is wrong |
|---|---|---|
| 1 | "Price reductions surged 50%" | From the eleven inputs you cannot compute a change in price cuts at all — there is no prior week in the data. The model invented a comparison. Even with a prior week, 6 against 4 is inside ±√n noise (Lesson 3.4). |
| 2 | "Selling for 16% below asking price" | The two-population error from Lesson 3.7. The gap compares unsold asks to sold prices. The actual discount figure is close-to-list: 3.8%, not 16%. This sentence is four times wrong and will be repeated back to you by a seller. |
| 3 | "Net absorption turned negative for the first time" | "For the first time" is unsupported — no history was provided. And a −1 reading is within one listing of zero (Lesson 3.10). Presented as decisive; is statistically nothing. |
| 4 | "Days on market climbing to 58" | "Climbing" implies a direction nobody supplied. 58 is a level. And per Lesson 3.1, DOM on actives can rise because good homes sold — the survivorship trap. |
Every error is the model supplying a direction where you only gave it a level. "Surged", "climbing", "turned negative for the first time", "down sharply" — four invented trends, because a single week of data contains no trends, and narrative prose wants verbs.
This is not a model defect you can prompt away entirely. It is why the review step is permanent, why the prompt says "do not invent any figure I did not give you", and why week-log.csv exists — once the model has four weeks, its directional language becomes true instead of decorative.
Take your own first brief. Underline every verb implying direction or change: rose, fell, surged, cooling, climbing, shifting. For each one, write next to it the two numbers that justify it. Any verb you cannot support with two numbers gets cut. Count how many survive. Most agents' first brief loses between four and seven.
A prompt you supervise can be sloppy — you correct it in the next message. A scheduled prompt gets no second message.
| # | Component | What it does | What breaks without it |
|---|---|---|---|
| 1 | Role + scope | Who it is and what it reasons about | Generic framing; writes for no one in particular |
| 2 | Data contract | Exactly what it will receive, and what it must never ask for | It requests your hot sheet, or silently assumes missing fields |
| 3 | Derivation instructions | The computations to perform, named explicitly | It summarises your inputs back at you instead of reasoning |
| 4 | Interpretation rules | How to read a result once computed — the conditional logic | The page-17 failure: fluent, confident, wrong |
| 5 | Output contract | Sections, lengths, audience split, format | Your pricing strategy ends up in the client email |
| 6 | Guardrails | What it must not do, and what to do when unsure | Invented figures, invented directions, smoothed-over gaps |
Most prompt advice covers 1, 3 and 5. Components 2, 4 and 6 separate a prompt that works while you watch from one that works while you sleep.
That sentence is Lesson 3.7 compiled into an instruction. Without it the model takes the dramatic reading. You are not asking for care in general — you are encoding one specific, known failure.
For any system: list the three ways the output could be confidently wrong, then write one interpretation rule per failure. That is where your expertise enters. Anyone can write components 1, 3 and 5; only you know what this output looks like when it is wrong in your market.
| Weak guardrail | Strong guardrail |
|---|---|
| "Be accurate." | "Do not state any figure I did not give you. If something cannot be derived from these inputs, say so." |
| "Use my voice." | "Write in the voice described in the Voice Print file in this project" — plus the file. |
Weak guardrails name a virtue; strong guardrails name a test. A model cannot check itself against "be accurate". It can check a sentence against "would this be true in a different market?"
The full text is in Appendix C. Here is why each part of it exists.
| Component | The actual line | The reasoning |
|---|---|---|
| 1 Role | "You are my market analyst for [NEIGHBOURHOOD], a farm of [N] homes." | Analyst, not copywriter. Sets the register and makes it reason before it writes. |
| 2 Data contract | "I will give you aggregate figures only. You will never ask me for addresses or listing records." | Module 2 compiled into one sentence. Also stops the helpful-assistant failure of suggesting you paste more. |
| 3 Derivations | "Work out: year-over-year supply change; the gap between median list and median closed; what close-to-list says about correctly priced homes; cuts per new listing; net absorption." | Named explicitly, in order. Unnamed derivations do not happen. |
| 4 Interpretation | "If the gap is wide but close-to-list is still high, say explicitly that this is not falling prices." | Encodes Lesson 3.7. Prevents error #2 on page 17 — the one that gets quoted back at you. |
| 5 Output | "Produce TWO parts. PART A — client-ready, ~250 words, no bullet lists. PART B — for me only." | The audience split. Without it your pricing strategy reaches 400 inboxes. |
| 5b Output | "Finish with a line headed 'What I would otherwise have missed'." | Asks for the overlooked thing explicitly. You get what you name. |
| 6 Guardrail | "Do not invent any figure I did not give you. If something cannot be derived, say so." | The last line, deliberately — recency weighting. This is the one that would have caught three of page 17's four errors. |
The prompt does not say "be insightful", "write compellingly" or "act as a world-class analyst". Adjectives of quality do nothing — the model has no dial for insight. Every instruction in the prompt is either a computation, a conditional, a format, or a prohibition. All four are checkable.
An agent writes this and schedules it:
Answer key: Appendix A, page 33.
The architectural choice that makes content specific, and the prerequisite that makes it sound like you.
The strongest line in the System 2 prompt is a test the model can actually apply:
"AI writes in your voice" is only true if it has a corpus of your voice. Without that file System 2 produces competent, interchangeable copy — and the agent blames the model rather than the missing input.
The corrected description matters more than the samples. Samples show the model what you did; the description tells it what is essential versus incidental.
If System 1's output is thin, System 2 produces well-voiced thin content. Chaining propagates quality in both directions. Fix the brief first — this is why Module 3 is twice the length of Module 4.
Same three numbers, four different jobs. Note that none of the four repeats another.
| Piece | When | Angle | The job it does |
|---|---|---|---|
| Number post | Thursday | The $160,000 gap, corrected | Argues — makes you the one who read it right |
| Buyer post | Saturday | Supply as negotiating room | Reframes — reaches the half of the audience the first post ignored |
| Authority post | Tuesday | The Sunday ritual itself | Demonstrates — proves diligence instead of claiming it |
| Reel | — | Three numbers as a countdown | Reaches people who will never read 150 words |
| Sphere email | Tue 7am | Part A, plus two lines | Goes to people who already know you |
Structure worth copying: two numbers → the gap → the correction → what to do. The correction is the whole post. Without it this is the same market update everyone else posted.
This post sells the process, not a listing — which is why it is the one that brings referrals rather than enquiries. Note it survives the specificity test only because of the second paragraph.
Half your business comes from your database. This module is about sorting it defensibly.
The 2026 NAR Member Profile reports that the typical REALTOR® earned 28% of business from repeat clients and 22% from past-client referrals in 2025. Half the business is already in the CRM. The same report shows the split widening with experience — 49% repeat plus 32% referral at sixteen-plus years, against zero on both for agents with two years or less.
Your attention has a structural bias. Recent clients feel live; old clients feel closed. But the two strongest predictors of a move — tenure and equity — both increase with time, which means the people most likely to move are precisely the ones who feel most finished.
A scoring model that returns the five people you would have called anyway has told you nothing and cost you an hour. If the output never surprises you, the weights are wrong — you have encoded your own bias into arithmetic and given it the authority of a number. Expect to disagree with two of the five. Those two are what you paid for.
Every candidate input must pass both:
| Test | The question | Fails look like |
|---|---|---|
| Predictive | Does this plausibly relate to whether they will transact? | Lead source from nine years ago. Interesting, not predictive. |
| Defensible | Is it a behavior, a stated preference, or a fact about the property — never a characteristic of the person? (Module 2) | Household size. Predictive, and disqualified. |
Note the asymmetry: an input that is defensible but weakly predictive just adds noise. An input that is predictive but not defensible is a liability no matter how well it performs. The second test is a veto, not a tiebreaker.
Weights are editorial judgements, not discoveries. What matters is that yours are deliberate and written down.
| Input | Max | Why that size |
|---|---|---|
| Stated signal | 25 | The largest single term, deliberately. Someone telling you they are thinking of moving outranks every inference you could make. It should be able to lift a contact several places on its own. |
| Equity gain | 30 | Highest ceiling, but it takes a 150% gain to max it. Equity enables a move; it does not motivate one. Big range, gentle slope. |
| Months since contact | 19 | Deliberately sizeable. This is the correction for your attention bias — it actively pushes forgotten people up. |
| Tenure | 15 | A step, not a slope: 7 years is a meaningful threshold, 14 years is not twice as meaningful as 7. |
| Touch neglect | 10 | A bonus on top of the contact gap, catching people on a mailing list who have had no real contact. |
| Seller relationship | 5 | Small on purpose. A tiebreaker, not a driver. |
Equity capped at 150%: a client who bought in 1998 might show a 400% gain. Uncapped, that is 80 points and they top the list forever regardless of every other signal. The cap says "beyond 150%, more equity does not make a move more likely" — which is true.
Contact gap capped at 24 months: someone untouched for eight years is not four times more urgent than someone untouched for two. Past about two years the signal saturates — they are cold, and the degree of cold stops mattering.
The general rule: cap any input where the real-world relationship flattens out. Uncapped linear terms let outliers dominate, and your list becomes the same five people every week — which is how these systems get abandoned.
Do this once and you can audit every list the model hands you.
Given: past client (seller+buyer) · bought 2012-11-19 for $362,000 · value $1,220,000 · tenure 14.0 yrs · last contact 2026-01-30 · 1 touch in 12 months · signal: "asked what the house would bring today"
| Term | Working | Points | Note |
|---|---|---|---|
| Equity gain | (1,220,000−362,000)÷362,000 = 2.370 → cap 1.50 × 20 | 30.0 | Cap binds |
| Tenure | 14.0 years ≥ 7 | 15.0 | Top step |
| Months since contact | 9.1 months × 0.8 | 7.3 | Under the cap |
| Stated signal | Signal present | 25.0 | Full term |
| Touch neglect | 1 touch in 12 months, not 0 | 0.0 | Does not trigger |
| Relationship | Has been a seller | 5.0 | Tiebreaker |
| TOTAL | 82.3 | Rank 1 of 40 |
A.D. tops the list on three strong terms, not one — equity at the cap, tenure at the top step, a stated signal. Compare rank two:
| Contact | Equity | Tenure | Gap | Signal | Neglect | Rel. | Total |
|---|---|---|---|---|---|---|---|
| A.D. | 30.0 | 15.0 | 7.3 | 25.0 | 0.0 | 5.0 | 82.3 |
| P.R. | 30.0 | 15.0 | 19.2 | 0.0 | 10.0 | 5.0 | 79.2 |
P.R. gets there differently: no signal, but the contact gap is at its cap and the neglect bonus fires. A.D. asked a question you never answered; P.R. you lost touch with entirely. Different calls — which is why the prompt asks for a reason per contact, not just a ranking.
Today is 2026-11-01. Show your working.
| Contact | Relationship | Bought | Paid | Value | Last contact | Touches | Signal |
|---|---|---|---|---|---|---|---|
| R.K. | past client (buyer) | 2021-03-15 | $710,000 | $905,000 | 2026-09-02 | 4 | none |
| T.W. | past client (seller) | 2014-06-20 | $405,000 | $1,015,000 | 2024-08-14 | 0 | none |
| N.B. | sphere | — | — | — | 2026-10-06 | 6 | asked about rates |
Answer key: Appendix A, page 33.
Diagnose by symptom. Change one weight at a time, and write down why.
| Symptom | Likely cause | The adjustment |
|---|---|---|
| Same five people every week | An uncapped or over-weighted term; or you are not logging outcomes | Check your caps first. Then confirm you are writing call outcomes back — the model cannot know you rang them (Module 7). |
| All long-tenure, none recent | Tenure plus equity together dominate — they correlate, so you are effectively double-weighting the same thing | Drop tenure's top step from 15 to 10. They are not independent inputs and should not be weighted as if they were. |
| The list never surprises you | Contact-gap weight too low; you have encoded your own attention bias | Raise the gap multiplier from 0.8 to 1.2. Per Lesson 5.2, a model that only confirms you is worthless. |
| Sphere contacts never appear | Correct — they have no equity or tenure terms available | Not a bug. If you want sphere ranked separately, run them as a second list rather than distorting the weights. |
| People you just closed keep appearing | Stale export, or no exclusion rule | Refresh the export; add "exclude anyone who transacted with me in the last 6 months" to the prompt. |
| A signal from 2019 still scoring | No decay on the signal term | Add: signals older than 12 months score 10 instead of 25. A stated intention has a shelf life. |
One change per week, and write down what you changed and why. Change three weights at once and you cannot attribute the improvement. You also cannot explain the model any more, and explainability is the Fair Housing defence from Module 2 — a model you cannot narrate is a model you cannot justify.
The prompt's last section counts contacts meeting the ripe test — past client, 7+ years tenure, 60%+ equity gain — and reports how many have been contacted once or less in twelve months.
40-contact sample — 28 past clients, 12 sphere. Initials in place of names, per Lesson 2.4.
| # | Who | Score | Tenure | Equity | Why they surfaced |
|---|---|---|---|---|---|
| 1 | A.D. | 82.3 | 14 yrs | 237% | Asked what the house would bring today |
| 2 | P.R. | 79.2 | 13 yrs | 208% | No contact in 24 months |
| 3 | J.L. | 77.7 | 13 yrs | 176% | Downsizing comment in July |
| 4 | D.F. | 75.3 | 14 yrs | 246% | No contact in 19 months |
| 5 | M.N. | 73.4 | 14 yrs | 199% | No contact in 17 months |
Scores cluster between 73 and 82 — the gaps are small. Treat the top five as a set, not a strict order; the difference between rank 4 and rank 5 is two points and well inside the noise of your own value estimates.
1 · A.D. — stated signal. Quote it back.
"You asked me a while back what the house would bring today. I finally have a straight answer for you, and it changed this month — asking prices in Coral Ridge are running about $160,000 ahead of what's actually closing. I'd rather tell you what you'd really get than what you'd like to hear. Ten minutes this week?"
2 · P.R. — no signal, 24-month gap. Own the silence.
"It's been far too long and that's on me. I'm not calling with a pitch — I'm calling because you've been in that house thirteen years and I don't think you know what it's worth now. Want me to send you the real number?"
Both lines come from the same model. They differ because the reason differs — which is why the prompt requires a reason per contact. A ranking without reasons produces five identical calls, and identical calls to people in different situations is how you waste the best five names in your database.
Twenty minutes once. Do it only after the prompts produce output you would use.
A scheduled bad prompt produces bad output reliably, every week, and you stop reading it by week three. Run by hand until the output is worth automating. This ordering is the single biggest predictor of whether the system is still running in March.
| # | Task | When | Needs from you |
|---|---|---|---|
| 1 | Week Brief | Sunday evening | This week's eleven numbers, and it appends them to week-log.csv |
| 2 | Content Batch | 30 min after task 1 | Nothing — reads the brief |
| 3 | Monday Call List | Sunday evening | Nothing, if the export is current |
On the $0 tier, merge 1 and 2 into a single task (Lesson 1.6) — you cannot guarantee ordering inside a window.
| Symptom | Cause | Fix |
|---|---|---|
| Output ignores your files entirely | Task attached to a plain chat, not the project | Recreate inside the project. The commonest week-one failure. |
| Content batch is generic | Task 2 ran before task 1 finished — it read an empty brief and did not error | Stagger by 30 min, or merge the two tasks |
| Call list repeats last week exactly | No outcomes logged; the database is unchanged | Module 7. The system's only maintenance cost. |
| A task silently stopped firing | You added a fourth and hit the tier limit | Check the active-task count before adding anything |
| Brief asserts trends in week one | No history in week-log.csv yet | Expected. Add "state levels only until four weeks are logged" to the prompt. |
| Output quality drifted over months | Project files went stale — old export, outdated Voice Print | Refresh the export monthly; re-check the Voice Print quarterly |
| Step | Who | Time |
|---|---|---|
| Read your market report, type in the eleven aggregates | You | 10 min |
| Three tasks run | Scheduled | Unattended |
| Review: figures trace, verbs supported, voice right | You | 10–15 min |
| Monday: five calls, log every outcome | You | ~45 min + 30 sec/call |
| Total Sunday time | 20–25 min |
System 3 reads database fields. If you call A.D. on Monday and write nothing down, next Sunday surfaces A.D. again with the same opening line, and the week after that too. Thirty seconds of logging per call is the entire upkeep of this system.
Minimum to write back: date contacted, outcome, and any new stated signal. That third field is how a passing remark in November becomes the top-ranked call in March.
| Week | What you do |
|---|---|
| 1 | Build the project. Run System 1 by hand. Fix the brief until you would send it. Log week 1 in week-log.csv. Schedule nothing. |
| 2 | Add Systems 2 and 3, still by hand. Run the ripe test and write the number down. Make the five calls Monday and log every outcome. |
| 3 | Now schedule. Confirm all tasks fire. Compare week 3's brief to week 1's — the first comparison you could not make before. |
| 4 | Tune one weight (Lesson 5.9), add your banned phrases, and leave it alone. With four weeks logged the brief can finally speak about direction honestly. |
The ones you cannot do point at the module to revisit. Be honest; nobody is marking this but you.
| ✓ | I can… | Module |
|---|---|---|
| Name what a scheduled task can and cannot see, and why it has no memory of last week | 1 | |
| Say which of my three systems is not truly unattended, and why that is deliberate | 1 | |
| Classify any field into Category A/B/C/D and state what each permits | 2 | |
| Run the three-question field test from memory | 2 | |
| Detect a proxy variable and name its behavioral substitute | 2 | |
| Compute months of supply two ways and interpret a disagreement | 3 | |
| Apply the ±√n test and say what I may claim at a given sample size | 3 | |
| Explain why the ask-to-close gap is not a discount, and name the figure that is | 3 | |
| Spot an invented direction verb in an AI-written market update | 3 | |
| Name the six prompt components and what fails when each is missing | 4 | |
| Write an interpretation rule that encodes a failure I know from my own market | 4 | |
| Score a contact by hand and audit the model's arithmetic | 5 | |
| Explain why each cap exists and what happens without it | 5 | |
| Diagnose a list that never surprises me, and fix it with one weight change | 5 |
| The farm I am running this on | |
| The Sunday I start | |
| My ripe-test number, and the one I will fix first | |
| The week I will schedule (not week 1) |
1. Why it worked the first week. The contact data was pasted as literal text inside the task prompt, so it was physically present in the instruction. The task needed no file access because the data was the prompt.
2. Why it is wrong by week four. That paste is a frozen snapshot. A scheduled task has no memory and, outside a project, no file access — so every Sunday it re-reads the same October data. Closed deals, new contacts and logged outcomes are invisible. The output is not stale-looking; it is confidently current-sounding and a month out of date.
3. The fixes. One word: project — attach the task to a project holding the export as a file. Better: that plus refresh discipline, since a file is only as fresh as your last export. Refresh monthly, write call outcomes back weekly (Module 7) — otherwise a file-based system fails the same way, just slower.
| # | Column | Cat. | Action | Reason |
|---|---|---|---|---|
| 1 | contact_full_name | D | Replace with initials | Ranking never needs identity; rejoin names from your CRM afterwards |
| 2 | purchase_price | A/D | Keep · score | Half of the equity calculation |
| 3 | mls_number_of_purchase | C | Drop | An MLS record identifier — licensed data, and it does nothing for the model |
| 4 | years_owned | A | Keep · score | Tenure. A date difference, not a characteristic |
| 5 | bedrooms_at_purchase | D | Do not score | Proxies familial status |
| 6 | agent_notes_freetext | D | Strip or curate | Eleven years of prose containing protected characteristics |
| 7 | last_contact_date | A | Keep · score | A fact about your own conduct |
| 8 | preferred_language | D | Do not score | Proxies national origin |
| 9 | competitor_listing_they_viewed | C/A | Reduce | Keep the behavior ("viewed a home in the $900k band"), drop the listing detail |
| 10 | estimated_current_value | A/B | Keep · score | Other half of equity |
| 11 | lead_source | A | Keep | Defensible but weakly predictive — noise, not harm |
| 12 | household_size_estimated | D | Do not score | Familial status, and "estimated" means you inferred it |
1. The three hard stops are #5, #8 and #12 — and the reasons are genuinely distinct: bedrooms proxies familial status; preferred_language proxies national origin; household_size is familial status arrived at by inference, which is the Lesson 2.7 failure in its purest form.
2. The most dangerous innocuous-looking column is #6, agent_notes_freetext. Structured columns are easy to audit because you can read the header. Eleven years of free text will contain "going through a divorce", "expecting in March", "mother moving in", "waiting on her visa" — protected characteristics in prose, invisible to a header scan and fully visible to a model.
3. The Category C column most people miss is #3, mls_number_of_purchase. It looks like harmless metadata about your own past deal. It is an MLS record identifier.
4. Behavioral substitutes. bedrooms → "has viewed larger homes" (something they did). preferred_language → a preference they stated to you and you recorded as a preference. household_size → nothing inferred; only a stated signal such as "mentioned needing more space".
Q1 — Cross-check week 4. 53 ÷ 19.0 = 2.789, reported 2.8. They agree, so the inventory and absorption inputs are mutually consistent. Run this every week: when it disagrees, one of the two numbers has been redefined — usually the active count quietly starting or stopping including contingents.
Q2 — Price cuts 4, 6, 5, 11. Prior three-week average = 5.0. √5 = 2.24, so a normal week runs roughly 2.8 to 7.2. Week 4's 11 sits about 2.7 standard deviations above — outside normal variation and worth attention.
What you may say: "Eleven sellers reduced their price this week, against about five in each of the previous three weeks." A count, with its comparison base stated. What you may not say: "Price cuts more than doubled" as evidence of a market shift — one outlier week is not a trend, however large. Log it and watch week 5.
Q3 — The gap, and the trap. Week 1: $845k − $792k = $53k (6.7% above). Week 4: $831k − $790k = $41k (5.2% above). The gap narrowed. Close-to-list over the same period fell from 97.8% to 96.4%.
Do they agree? They appear to contradict — a narrowing gap sounds like convergence, falling close-to-list sounds like weakness. Resolve it by asking which median moved: median list fell $845k→$831k while median closed was flat $792k→$790k. The gap narrowed because sellers cut their asking prices, not because buyers paid more. Combined with close-to-list falling, both figures say the same thing: sellers are repricing downward and still conceding more at the table. A narrowing gap is not automatically good news, and this is exactly the two-population care from Lesson 3.7.
Q4 — DOM 41→52 while inventory 48→53. Straightforward reading: homes are taking longer and stock is building — softening. Survivorship reading (Lesson 3.1): DOM on actives can rise because fast homes sold and slow ones remain. Here the survivorship explanation is weak, because inventory rose at the same time — if good stock were clearing, inventory would fall. The settling metric: median DOM of sold homes. If solds' DOM is flat while actives' DOM climbs, you are accumulating stale inventory rather than selling quickly. Pendings (6, 7, 5, 4 — falling) point the same way.
Q5 — Net absorption, and a contradiction worth finding. (pending + closed) − new, by week: +4, +6, +2, +1, total +13.
A positive total means more homes left than arrived, so inventory should have fallen by about 13. Inventory rose by 5. That is an 18-home discrepancy, and finding it is the point of the question. The usual explanation: your MLS keeps pending homes in the active count until they close, so "went pending" is not an exit. Other candidates are relistings and expired listings returning.
Signal or noise? Each week's figure rests on flows of 4–11 events, so no single week means much. But the direction is consistently downward (+4, +6, +2, +1) across four weeks, and per Lesson 3.4 four-week direction is where trends legitimately live. Treat it as suggestive — and do not quote the absolute values at all until you have resolved the inventory contradiction.
Q6 — Model lead sentence. Confidence hierarchy says lead with stock-based figures: inventory 48→53 (+10%), months of supply 2.4→2.8 (+17%).
"Inventory here has risen from 48 homes to 53 over the past month, lifting months of supply from 2.4 to 2.8 — still firmly a seller's market by any historical measure, but with noticeably more competition than four weeks ago."
Why this and not the price cuts: eleven cuts is the dramatic number, and it is a single noisy week. Inventory and months of supply are stock-based, reliable at this sample size, and the "+17% but still a seller's market" framing is both true and more useful than alarm. Note it also refuses the easy narrative — which is what makes you the one worth listening to.
1. Components present and missing. Present: 1 (role), weakly — "expert real estate market analyst" is a job title, not a scope. Partially present: 5 (output) — "for my clients" implies an audience but gives no sections, length or format. Missing entirely: 2 (data contract), 3 (derivations), 4 (interpretation rules) and 6 (guardrails).
2. Three specific failures on the first unattended run.
3. Why silent failure beats a crash. A crash is visible and gets fixed Monday. This produces confident, wrong output every week, and it goes to clients. Repetition breeds trust — by week six nobody reads it closely, which is when an invented figure gets quoted back to you.
4. Model rewrite — all six components:
| Contact | Equity | Tenure | Gap | Signal | Neglect | Rel. | TOTAL |
|---|---|---|---|---|---|---|---|
| T.W. | 30.0 | 15.0 | 19.2 | 0 | 10.0 | 5.0 | 79.2 |
| N.B. | 0 | 0 | 0.7 | 25.0 | 0 | 0 | 25.7 |
| R.K. | 5.5 | 8.0 | 1.6 | 0 | 0 | 0 | 15.1 |
Working: T.W. equity (1,015,000−405,000)÷405,000 = 150.6% → capped 1.50 × 20 = 30.0 · tenure 12.4 yrs → 15 · gap 26.6 mo → capped 24 × 0.8 = 19.2. R.K. equity 27.5% × 20 = 5.5 · tenure 5.6 yrs → 8 · gap 2.0 mo × 0.8 = 1.6. N.B. gap 0.9 mo × 0.8 = 0.7 · signal 25.
1. T.W. ranks highest at 79.2, more than three times R.K.
2. What N.B. reveals. N.B. has the single largest term in the model (a stated signal, 25 points) and still finishes at 25.7, because equity and tenure are unavailable for a sphere contact. Sphere contacts are structurally capped at roughly 44 points (signal + a maxed contact gap) and can never compete with a past client. This is correct behaviour, not a flaw — the model was designed to rank people whose property position you know. But it means a hot sphere lead will sit invisibly at rank 20. Per Lesson 5.9, run sphere as a separate list rather than distorting the weights to force them in.
3. What carries T.W., and what the caps do. Equity (30.0, at the cap) and the contact gap (19.2, at the cap), with tenure 15 and the neglect bonus 10 behind them. Both caps bind: raw equity is 150.6%, just over the 1.50 ceiling; the real gap is 26.6 months against a 24-month ceiling. Uncapped, T.W. would score 81.4 instead of 79.2 — the caps cost 2.2 points here, which changes nothing. That is the sign of well-set caps: they are invisible in ordinary cases and only bite on genuine outliers.
4. Instinct versus model. The model is right — the Lesson 5.2 case exactly. R.K. feels live: four touches, contacted eight weeks ago. But they are 5.6 years in with 27% equity — well-served, not move-likely. T.W. is twelve years in with 150% equity and has not heard from you in two years. R.K. feels current because you have been talking to them, which is a fact about your attention, not their intentions. A list that never disagrees with you is your own bias wearing the authority of a number.
Everything you need at the desk on a Sunday. Formulas, reliability, and the trap in each.
| Quantity | Formula | Small-n | The trap |
|---|---|---|---|
| Months of supply (absorption) | active ÷ avg monthly closings | Solid | Backward-looking by 30–60 days |
| Months of supply (pending) | active ÷ monthly pendings | Careful | Overstates if fall-through is high |
| Year-over-year supply | (MOI now ÷ MOI last year) − 1 | Solid | Needs the same active definition both years |
| Ask-to-close gap | median list (active) − median closed | Careful | Two populations — not a discount |
| Negotiation room | 100% − close-to-list | Careful | Against final list — hides reductions |
| Seller pressure | price cuts ÷ new listings | Noisy | One seller can cut three times |
| Net absorption | (pending + closed) − new | Noisy | Pendings may still sit in active inventory |
| Noise band | n ± √n | — | Below n=5, report counts only |
| Equity gain | (value − paid) ÷ paid | — | Only as good as your value estimate |
1. Who owns it? MLS or another broker → stop. 2. One home or many? One identifiable property → stop. 3. Could I publish it? If yes, it is safe to compute with.
Component numbers in brackets refer to Lesson 4.1. Replace the bracketed placeholders and save each as a task.
You are my market analyst for [NEIGHBOURHOOD], a farm of [N] homes. I will give you aggregate figures only — counts, medians and ratios. You will never ask me for addresses, MLS numbers or listing records. [1,2]
THIS WEEK, ending [DATE]:
New listings: [ ] · Price changes: [ ] (median change [ ]%)
Went pending: [ ] · Closed: [ ] · Withdrawn/expired: [ ]
Active inventory: [ ] · Median list (active): $[ ]
Median DOM (active): [ ] · Median closed (30d): $[ ]
Close-to-list (30d): [ ]% · Months of inventory: [ ] (same week last year: [ ])
Absorption (3-mo avg): [ ] closings/month
MY OWN LISTINGS: [DOM for each] · Pending: [ ] · Showings last 7 days: [ ] · Seller updates due: [ ]
Also read week-log.csv in this project for prior weeks, and append this week's figures to it. [memory, Lesson 1.2]
Work out: year-over-year change in months of supply; the cross-check of active ÷ absorption against the reported months of inventory; the gap between median list and median closed; what close-to-list says about correctly priced homes; price cuts per new listing; net absorption. [3]
INTERPRETATION RULES: [4]
— If the ask-to-close gap is wide but close-to-list is still high, say explicitly that this is NOT falling prices, and explain that the gap reflects mispriced unsold stock rather than a discount on any individual home.
— Do not describe any metric as rising, falling, surging or cooling unless week-log.csv gives you at least two time points for it. With fewer than four weeks logged, report levels only.
— For any weekly count below 5, report the count and do not compare it to another week.
— If the cross-check disagrees with the reported months of inventory, say so and stop treating either as reliable.
PART A — CLIENT-READY. About 250 words, plain language, no jargon, no bullet lists. Lead with the single most important relationship between these numbers, not a recap of them. Close with one short paragraph for sellers and one for buyers, then an invitation to reply for their own street. [5]
PART B — FOR ME ONLY. Rank my listings against the market median DOM and name which needs a price conversation this week, with the evidence to carry into that call. Flag any listing approaching the median. List the seller calls owed. Finish with a line headed "What I would otherwise have missed". [5]
Do not state any figure I did not give you or that cannot be derived from these inputs. If something cannot be derived, say so rather than estimating. [6]
Runs after System 1 and reads its output. On the $0 tier, merge this into the System 1 task (Lesson 1.6).
Using the Week Brief you produced for [NEIGHBOURHOOD] this week, and writing in the voice described in my Voice Print file in this project, produce the week's content. [1,2]
Every piece must be built from THIS week's figures in THIS farm. If a sentence would still be true in a different market, cut it. [4]
1. THE NUMBER POST (LinkedIn + Facebook, ~150 words). Lead with the sharpest number in the brief, then correct the obvious misreading of it, then say what a seller listing before spring should do differently.
2. THE BUYER POST (Instagram + Facebook, ~120 words). Reframe the supply figure from the buyer's side. Do not say prices are falling. Say what the buyer has now that they did not have a year ago.
3. THE AUTHORITY POST (LinkedIn, ~140 words). The subject is the weekly process itself, not the market. Describe what I run every Sunday, then the specific thing it caught this week.
4. THE REEL SCRIPT (32 seconds, vertical). A table: beat, on-screen text, spoken line. Build around the three strongest numbers as a countdown. Last beat is a follow prompt. Add a caption under 25 words.
5. THE SPHERE EMAIL. Subject under 50 characters built on the sharpest number. Body is Part A unchanged, plus one opening line and one closing line inviting a reply. [5]
Rules: no hashtag stacks, no emoji beyond one in the caption, no exclamation marks, no "the market is shifting", [YOUR BANNED PHRASES]. Never state a figure that is not in the brief. If the brief is missing or empty, stop and tell me rather than writing from general knowledge. [6]
Read the contact file in this project. Score every contact and return my call list for the week beginning [DATE]. [1,2]
SCORE ON THESE SIX INPUTS ONLY: [3]
1. Equity gain — (estimated value − purchase price) ÷ purchase price. Score gain × 20, capped at 150%.
2. Tenure — years in the home. +15 if 7 or more, +8 if 5 to 7, otherwise 0.
3. Months since last contact — +0.8 per month, capped at 24 months.
4. Stated or observed signal — +25 if the signal field contains anything other than "none".
5. Touch neglect — +10 if touches in the last 12 months is zero.
6. Relationship — +5 if they have been a seller with me.
YOU MUST NOT score, sort, group or comment on age, race, religion, national origin, familial status, disability, or any field that could stand in for one of those. If a column in my file looks like a proxy for a protected characteristic, ignore it and tell me which column you ignored and why. [4,6]
Exclude anyone who transacted with me in the last 6 months. Treat a stated signal older than 12 months as worth 10 rather than 25, and say that you have discounted it. [4]
RETURN: [5]
A. THE FIVE CALLS. Ranked, with the score decomposed into its six terms so I can audit the arithmetic. For each: who, tenure, equity gain, the specific reason they surfaced, and a two-to-four sentence opening line written for that person. Where the reason is a long silence, open by owning the silence, not with a pitch. Where they stated something, quote it back. Never open with a market statistic.
B. DRAFT, DON'T CALL. The next seven by score, each to receive the Week Brief plus one personalised line tied to their own tenure and equity. Flag any contact whose stated signal is time-sensitive and now stale, and say how stale.
C. THE AUDIT LINE. Count contacts that are past clients with 7+ years tenure and 60%+ equity gain. Of those, how many have been contacted once or less in 12 months? Give the combined equity gain of that group and one sentence on what the number means.
Do not invent contacts. If a field is blank, treat it as unknown rather than guessing, and say how many records you had to skip. [6]
Add to section A: "Compare this week's five against last week's five, which are in call-log.csv, and tell me if the same name has appeared three weeks running." A name that keeps surfacing and never gets called is the model telling you something about your own avoidance, not about the contact.
Every sourced figure in this course traces to one of these. Checked October 2026.
Absorption rate. Closings per month, usually a 3-month average. Divided into active inventory it gives months of supply.
Aggregate. A count, median or ratio describing many homes, carrying no individual record. Category B in Lesson 2.2.
Ask-to-close gap. Median active list minus median closed. Compares two different sets of homes — not a discount.
Cap. A ceiling on a scoring term, used where the real-world relationship flattens.
Close-to-list ratio. Median closed as a percentage of list. The genuine discount figure, because it compares each home to itself.
Months of supply. How long current inventory would take to clear at the current pace. Two formulas — Lesson 3.2.
Net absorption. Properties leaving minus arriving. Check whether your MLS keeps pendings in the active count.
Proxy variable. A field correlating with a protected characteristic without naming it. The main Fair Housing risk in any scoring model.
Ripe test. Past client, 7+ years tenure, 60%+ equity gain. Shorthand for move-likely.
Scheduled task. A prompt running on a cadence without you, starting cold each time.
Survivorship. Bias in any metric computed only on unsold homes — why active DOM can rise in a strengthening market.
Two-population error. Comparing two figures that describe different sets of homes as though they described the same ones.
Voice Print. A file of your own writing plus a corrected description of your voice, used as context so output sounds like you.